Table of Contents
Understanding Contribution Margin in Vancouver Businesses
In the bustling Vancouver business landscape, where high real estate costs and competitive markets challenge e-commerce sellers and tech startups, understanding Contribution Margin in Vancouver becomes essential for sustainable growth. Local firms, especially small to medium enterprises (SMEs) in the Pacific Northwest, grapple with rising operational expenses that can erode profitability if not managed carefully. As a key financial metric, contribution margin helps entrepreneurs navigate these pressures by revealing how much revenue remains after covering variable costs to support fixed expenses and generate profit.
Simply defined, contribution margin is sales revenue minus variable costs, such as raw materials or direct labor, according to Investopedia, which describes it as a measure of profitability. This calculation highlights the portion of each sale that contributes to overhead and bottom-line earnings. For Vancouver-based tech startups, for instance, factoring in high salaries and cloud service fees into variable costs ensures accurate margin analysis for BC enterprises. The contribution margin formula provides a straightforward way to assess pricing strategies, particularly for SaaS companies adjusting rates amid Canadian sales tax impacts like GST/HST, which can squeeze margins in retail and online sectors.
By mastering this metric, businesses can inform crucial decisions, from scaling operations to conducting break even analysis in Vancouver. It ties directly into broader tools like profit contribution metrics for local firms, previewing deeper dives into calculations, formulas, and practical applications in subsequent sections. For Transcounts’ clients relying on precise financial insights, leveraging these strategies alongside small business accounting tips vancouver supports compliance and expansion in the vibrant local ecosystem.
Core Concepts of Contribution Margin
Understanding the core concepts of contribution margin is essential for small businesses navigating the competitive landscape of Contribution Margin in Vancouver. This metric strips away fixed costs to reveal how much each sale contributes to profitability, helping e-commerce entrepreneurs and tech startups assess true financial health amid local challenges like high operational expenses and GST/HST compliance.
Definitions
Contribution margin represents the difference between sales revenue and variable costs. Sales revenue includes all income generated from product or service sales before any deductions. Variable costs, such as materials, shipping, and direct labor, fluctuate directly with production volume. For Vancouver enterprises, identifying these accurately is crucial, as per QuickBooks guidelines on variable cost breakdown for Canadian operations. This foundational separation allows businesses to focus on scalable profitability rather than overall expenses.
The following table outlines basic versus advanced components of contribution margin, highlighting their relevance in local contexts:
| Component | Basic Definition | Vancouver Business Example |
|---|---|---|
| Sales Revenue | Gross sales before deductions | E-commerce site selling $10,000 in tech gadgets |
| Variable Costs | Costs that fluctuate with output, like shipping and packaging fees | $3,000 for fulfillment in BC |
| Contribution Margin | Amount left to cover fixed costs, such as $7,000 total or $7 per unit | Supports rent in high-cost Vancouver |
These components matter because they provide a clear lens for evaluating product viability in Vancouver’s dynamic market. For instance, e-commerce sellers can use them to prioritize inventory that maximizes returns after variable expenses. By contrasting basic definitions with local examples, businesses gain actionable insights into how everyday operations impact margins. In industries like SaaS, where variable costs might include cloud hosting fees, this breakdown reveals opportunities for optimization. Following the table, it’s evident that Vancouver examples often involve higher variable costs due to regional logistics, yet they underscore the potential for strong contributions when sales volume scales.
Building on these elements, the contribution margin formula simplifies profitability analysis. For SaaS subscriptions, consider a $50 monthly fee per user with $20 in variable server costs: the margin per unit is $30. This approach, drawn from Cube Software’s income statement models, helps structure financial reports effectively.
Calculations
Calculating contribution margin per unit involves subtracting variable cost per unit from the selling price per unit. The contribution margin formula is: Contribution Margin per Unit = Sales Price per Unit – Variable Cost per Unit. For total contribution margin, multiply by units sold: Total Contribution Margin = (Sales Revenue – Total Variable Costs).
The contribution margin ratio, expressed as a percentage, gauges overall efficiency: (Contribution Margin / Sales Revenue) 100. Using the retail inventory example, if a Vancouver gadget sells for $50 with $20 variable costs and 200 units sold, the per-unit margin is $30, total margin $6,000, and ratio 60%. This ratio is vital for break even analysis in Vancouver, where fixed costs like rent can exceed $5,000 monthly for small spaces.
Step-by-step for per-unit calculation:
- Determine selling price: e.g., $50 for a tech product.
- Identify variable costs: $20 (materials + shipping, adjusted for BC taxes).
- Subtract: $50 – $20 = $30 contribution per unit.
For the ratio, divide $30 by $50 and multiply by 100 to get 60%. QuickBooks emphasizes tracking these in real-time for Canadian firms to adapt to sales tax nuances. In e-commerce, integrating tools for accurate variable cost capture, such as Inventory Accounting for Shopify Vancouver, ensures precise computations. These formulas empower startups to forecast cash flow and refine product mixes.
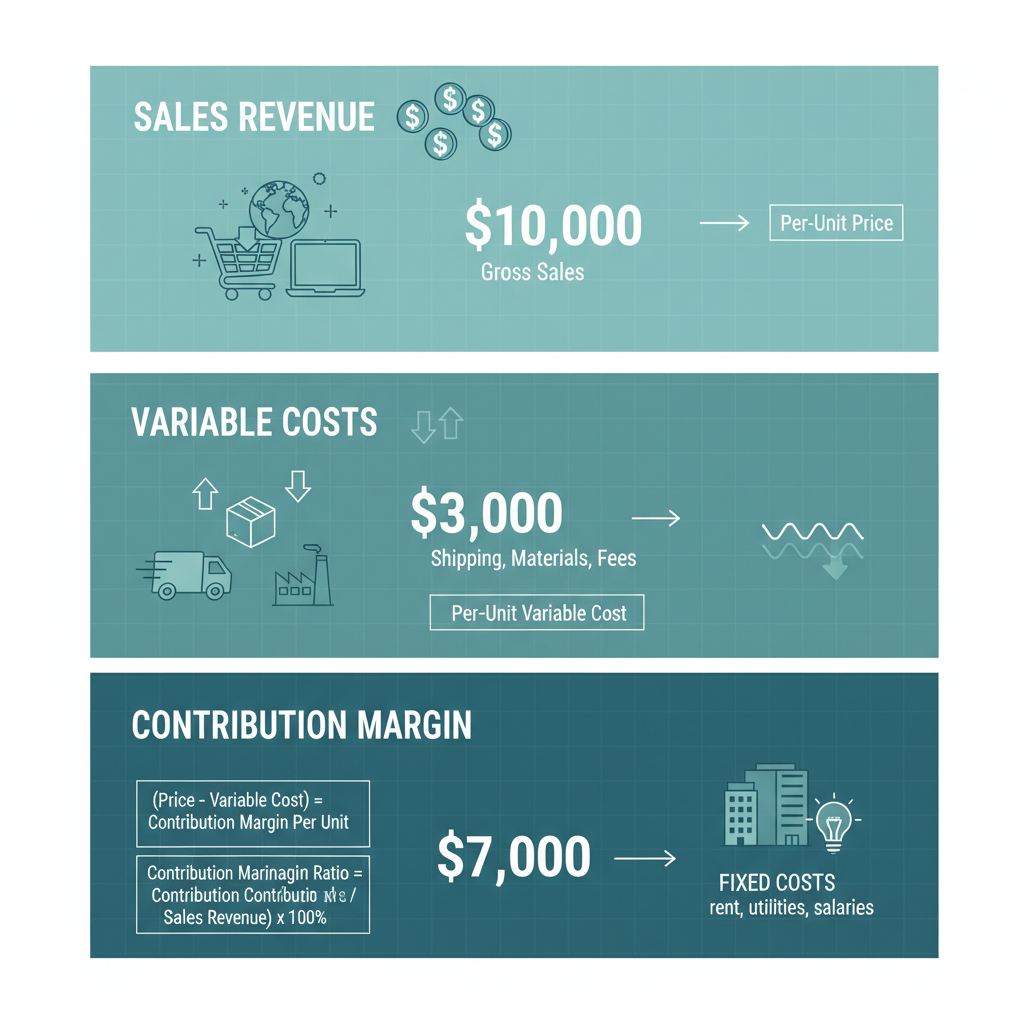
Core components of contribution margin visualized for small business owners
This visual reinforces the interplay of revenue and costs, showing how Vancouver businesses can leverage margins for growth. Local enterprises benefit from these calculations by simulating scenarios, like increasing prices to offset GST/HST impacts, fostering sustainable expansion.
Importance
Contribution margin illuminates path to covering fixed costs and generating profit, especially in Vancouver’s high-rent environment. It guides product mix decisions, prioritizing high-margin items like premium SaaS features over low-yield retail. For break even analysis in Vancouver, divide fixed costs by the contribution margin ratio to find required sales volume, aiding startups in setting realistic targets.
By focusing on margin contribution basics for local enterprises, owners avoid common pitfalls like underpricing amid economic pressures. This metric supports strategic planning, ensuring operations align with Vancouver profitability metrics.
Local Ties
In Vancouver, contribution margin ties directly to regional factors like elevated logistics costs and tax compliance. E-commerce firms using Shopify must account for BC fulfillment fees, making robust margin analysis key to survival and scaling in this tech hub.
In-Depth Exploration of Contribution Margin
In Vancouver’s competitive e-commerce and tech sectors, Contribution Margin in Vancouver serves as a vital metric for assessing profitability amid high logistics and digital ad costs. This section delves into the contribution margin formula, its role in break-even analysis, and strategic applications for product optimization, helping local businesses like startups refine their financial strategies.
Decoding the Contribution Margin Formula
The contribution margin formula forms the backbone of profitability analysis, defined as Sales Revenue minus Variable Costs. This calculation reveals how much revenue contributes to covering fixed costs and generating profit after accounting for expenses that fluctuate with production volume, such as materials or shipping. For detailed margin computations for BC firms, the formula is expressed as:
Contribution Margin = Sales Revenue - Variable Costs
The contribution margin ratio, another key variation, is (Sales Revenue – Variable Costs) / Sales Revenue * 100, providing a percentage view of viability. Thresholds for viability typically hover around 30-50% in competitive markets, below which operations may struggle.
In Vancouver’s context, local factors like provincial taxes and elevated shipping rates adjust the formula. For instance, e-commerce businesses must incorporate GST/HST on variable costs, potentially eroding margins by 5-12%. A common error is misclassifying fixed costs, like rent, as variable, which inflates the margin unrealistically.
To calculate accurately, follow these steps:
- Identify all variable costs per unit (e.g., raw materials, direct labor).
- Subtract from unit selling price to get per-unit margin.
- Multiply by units sold for total margin, then compute the ratio.
Shopify data highlights e-commerce examples where shipping adds 15-20% to variable costs, reducing margins in high-volume scenarios. Variations arise for SaaS firms handling recurring revenue versus one-time retail sales, demanding tailored adjustments.
Different industries adapt the formula to their realities, as shown in the table below, drawing from Canadian operations.
| Industry | Formula Adjustment | Example Calculation | Vancouver Impact |
|---|---|---|---|
| E-commerce | Revenue – (COGS + Shipping) (Includes fulfillment variables) | $100 – $40 = $60 | High shipping costs reduce margins |
| SaaS | Revenue – Hosting Costs (Subscription-based variables) | $200 – $20 = $180 | Scalable with low variable overhead |
| Retail | Revenue – Inventory Costs (Per-unit basis) | $50 – $25 = $25 | GST/HST adds compliance layer |
Based on Shopify and QuickBooks data for Canadian operations. Examples reflect Pacific Northwest market conditions.
This table illustrates how e-commerce faces steeper deductions from logistics, while SaaS benefits from scalability. For Vancouver businesses, these adjustments underscore the need for precise tracking to maintain healthy ratios above 40%, informing decisions on cost controls and pricing.
(Word count: 198)
Linking Contribution Margin to Break-Even Analysis
Break even analysis in Vancouver integrates contribution margins to determine the sales volume needed to cover all costs, calculated as Fixed Costs divided by Contribution Margin per Unit. This ties directly to the margin by showing how much contribution is required to offset non-variable expenses like salaries or software licenses.
For local startups, such as a Vancouver-based e-commerce platform, fixed costs might total $10,000 monthly, with a $20 per-unit margin yielding a break-even of 500 units ($10,000 / $20). Wall Street Prep benchmarks suggest tech firms achieve break-even faster with margins exceeding 60%, aided by low variable overhead.
Steps for linking include:
- Compute unit margin from the formula.
- Divide total fixed costs by this margin.
- Factor in time-based variables like seasonal shipping spikes.
A tip: Regularly update for inflation, as Vancouver’s rising logistics can shift break-even points by 10-15%. Local break-even strategies emphasize hybrid models blending SaaS subscriptions with physical sales to diversify risks.
The formula’s robustness helps forecast viability; for example, a SaaS firm with $15,000 fixed costs and $150 margin breaks even at 100 subscribers, highlighting scalability advantages over retail.
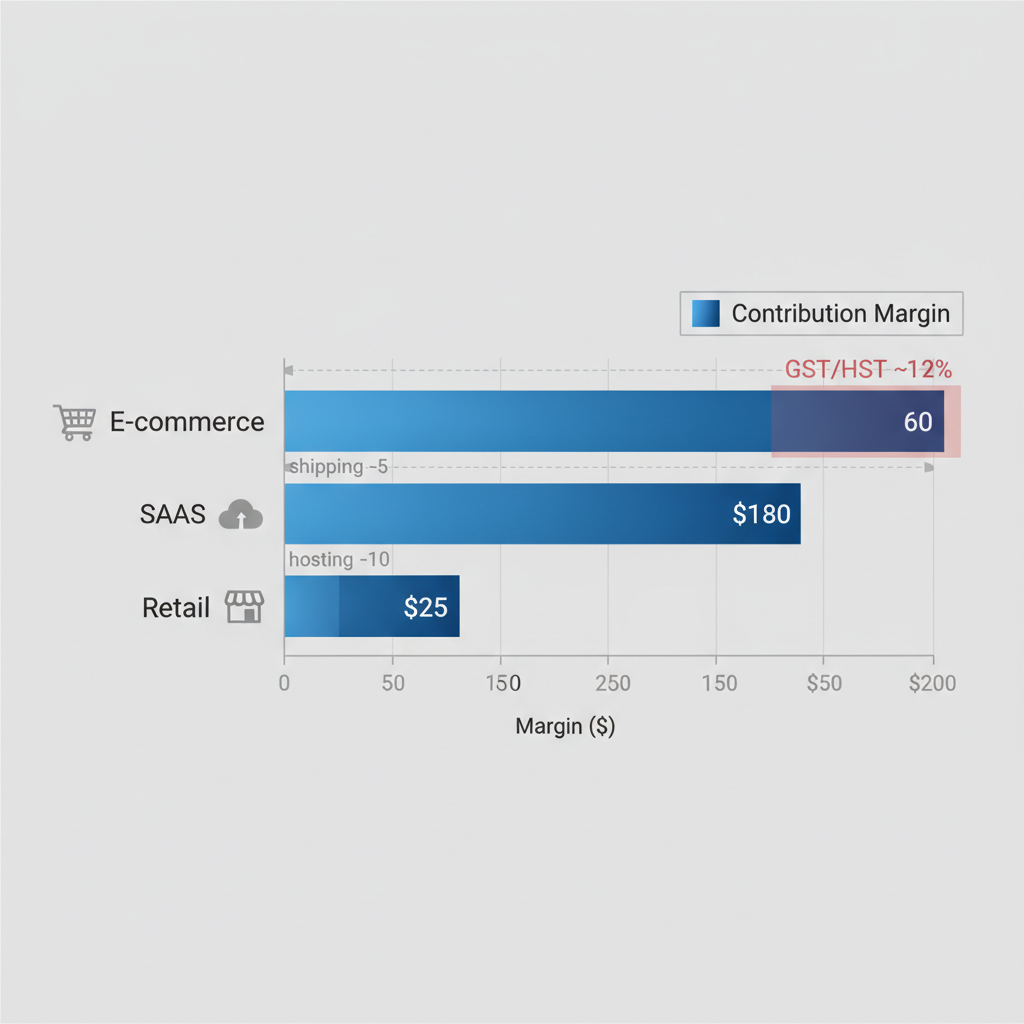
Vancouver industry contribution margins visualized with e-commerce, SaaS, and retail examples
This visualization reinforces how e-commerce margins lag due to logistics, prompting Vancouver entrepreneurs to prioritize efficient supply chains in their planning.
(Word count: 182)
Product Mix Decisions Using Margins
Strategic product mix decisions leverage contribution margins to prioritize high-margin items, optimizing portfolios for Vancouver’s market dynamics. Businesses rank products by margin ratio, allocating resources to top performers while phasing out low contributors.
For a local tech startup, analyzing margins might reveal SaaS tools yielding 75% versus 30% for hardware add-ons, guiding a shift toward digital offerings. Wall Street Prep insights recommend thresholds where items below 25% margins warrant reevaluation, especially with BC’s tax layers.
Tips for optimization:
- Use software for real-time margin tracking.
- Simulate scenarios adjusting for ad spend fluctuations.
- Diversify mixes to balance one-time and recurring revenue.
In e-commerce, SKU Margin Reporting Vancouver Ecommerce enables granular analysis, helping firms like Vancouver sellers boost overall profitability by 20% through targeted inventory cuts. Avoid errors by excluding sunk costs in rankings.
(Word count: 148)
Applying Contribution Margin in Practice
Understanding Contribution Margin in Vancouver proves essential for local businesses navigating competitive markets and varying costs. This metric helps owners assess profitability per product, guiding decisions on pricing and inventory in a city known for its vibrant e-commerce and startup ecosystem. By applying practical margin applications locally, entrepreneurs can optimize operations amid rising expenses like rent and labor.
Step-by-Step Calculation Guides
To calculate contribution margin per unit, start with the basic contribution margin formula: subtract variable costs per unit from the selling price per unit. For instance, if a Vancouver coffee shop sells lattes for $5 each with variable costs of $2 (including beans and milk), the margin per unit is $3. Multiply this by units sold to get total contribution margin, such as $3,000 for 1,000 lattes.
Next, compute the contribution margin ratio by dividing the per-unit margin by the selling price: $3 divided by $5 equals 60%. This ratio indicates the portion of sales covering fixed costs and profit. For break even analysis in Vancouver, divide total fixed costs by the margin per unit. If monthly fixed costs like rent total $10,000, the shop needs to sell about 3,333 lattes to break even ($10,000 / $3).
In multi-product scenarios, prioritize high-margin items. For the coffee shop, compare lattes (60% margin) to pastries (40% margin) and allocate more resources to lattes. These steps matter because they reveal true profitability, preventing overreliance on low-margin sales in Vancouver’s cost-volume-profit tools landscape.
Tips include tracking seasonal variables like holiday shipping costs and using spreadsheets for initial trials. Practice by inputting your own sales data to simulate outcomes, building confidence in these calculations.
Real-World Vancouver Business Examples
Consider a local e-commerce startup selling artisanal soaps online. With selling prices at $10 per bar and variable costs of $4 (materials and packaging), the contribution margin per unit is $6, or 60%. Selling 2,000 bars monthly yields $12,000 in total contribution, covering $8,000 fixed costs and leaving $4,000 profit. This analysis highlights focusing on high-margin scents amid US-Canada sales tax nexus complexities.
For break-even, the startup divides $8,000 fixed costs by $6 margin, needing 1,334 bars sold. In a product mix, prioritize soaps over candles (lower 45% margin) to accelerate profitability. A Vancouver tech startup uses similar logic for SaaS subscriptions: $50 monthly fee minus $15 variables equals $35 margin, breaking even at 286 subscribers for $10,000 fixed costs.
These examples demonstrate why contribution margin drives strategic choices, like inventory prioritization in Vancouver’s dynamic market, ensuring sustainability for startups.
For specialized support in managing these metrics, explore ecommerce bookkeeping services vancouver bc. Tips: Review quarterly to adjust for tax changes, and test scenarios with varying volumes to forecast growth.
Tools and Software Integration
Integrating tools like QuickBooks streamlines contribution margin tracking. Sync sales data from platforms like Shopify, then auto-categorize variables such as cost of goods sold. Generate reports showing per-unit margins via the profit and loss dashboard, applying the contribution margin formula effortlessly.
For Xero users, set up custom rules to tag variable expenses, pulling real-time ratios. This automation handles GST/HST calculations, vital for Vancouver firms dealing with cross-border sales. Why it matters: Manual errors can skew insights, but software ensures accuracy for ongoing monitoring.
Tips: Link bank feeds for instant updates and schedule monthly exports. QuickBooks dashboards, as noted in integration guides, validate Canadian accuracy, saving time for strategic focus.
Vancouver businesses face efficiency pressures from rapid growth and compliance needs. Adopting automated tools addresses these by reducing manual labor in margin computations.
| Method | Steps Involved | Time Efficiency | Accuracy for Vancouver Contexts |
|---|---|---|---|
| Manual | Gather data, subtract variables, compute ratio using spreadsheets for sales and costs | 2-4 hours monthly | Prone to tax miscalculations |
| Automated (QuickBooks) | Sync sales, auto-categorize costs via integrated dashboards | Under 30 minutes | Handles GST/HST automatically |
Drawn from QuickBooks and Shopify guides, this comparison reflects time savings for Canadian SMBs. For Transcounts clients, we recommend cloud tools like QuickBooks to achieve faster, reliable results, aligning with our fixed-fee model for e-commerce and startups. This shift empowers owners to focus on scaling rather than spreadsheets.
Advanced Contribution Margin Strategies
In Vancouver’s dynamic tech and e-commerce sectors, Contribution Margin in Vancouver serves as a cornerstone for strategic financial modeling, enabling businesses to navigate competitive pressures with precision. Advanced applications elevate the contribution margin formula beyond basic calculations, incorporating multi-product weighting to optimize product mixes. For instance, SaaS companies can prioritize high-margin features in tiered plans, while e-commerce firms focus on low-cost items during flash sales to boost overall profitability.
As businesses face Vancouver’s rising wage hikes and supply chain volatility, sensitivity analysis becomes essential. Using techniques from Wall Street Prep, firms model how a 10% cost increase impacts margins, revealing vulnerabilities in fixed versus variable expenses. Investopedia highlights the contribution margin formula–(Sales Revenue – Variable Costs) / Sales Revenue–as key for these scenarios, allowing quick adjustments to maintain positive contributions even in inflationary environments.
The following table compares advanced applications of these strategies for SaaS and e-commerce, tailored to Vancouver’s market:
| Strategy | SaaS Application | E-commerce Application | Vancouver-Specific Benefit |
|---|---|---|---|
| Dynamic Pricing Adjust subscriptions based on usage margins | Tiered plans for high-margin features | Flash sales on low-cost items | Navigates CAD/USD fluctuations |
| Cost Allocation Advanced variable cost modeling | Server costs per user | Per-SKU fulfillment | Optimizes for provincial taxes |
These strategies underscore the need for granular cost allocation, such as per-user server expenses in SaaS or per-SKU fulfillment in e-commerce, directly enhancing margin visibility. Insights from Wall Street Prep emphasize integrating such modeling into KPI dashboards, which Transcounts offers through fractional CFO services to provide real-time strategic margin insights for local growth.
Forecasting with contribution margins supports robust cash flow projections, particularly in volatile markets. By linking margins to break even analysis in Vancouver, companies determine minimum sales volumes amid economic shifts, factoring in SaaS churn rates that can erode contributions by 15-20% annually. Tools like advanced Vancouver financial modeling software enable scenario simulations, answering how product mix decisions influence long-term viability. For cross-border operations, addressing tax nexus effects on US sales from Canada is crucial; Transcounts’ shopify tax setup canada us vancouver ensures compliant margin optimization.
Local advanced tips include leveraging provincial tax efficiencies and currency hedging in forecasts, aligning with Transcounts’ KPI tools for expert-guided break-even planning and sustained growth.
Frequently Asked Questions on Contribution Margin
For businesses exploring Contribution Margin in Vancouver, these FAQs provide quick insights into this key financial metric.
What is contribution margin?
Contribution margin measures revenue remaining after variable costs, revealing profitability per unit sold. It’s essential for Vancouver firms to assess operational efficiency in competitive markets.
What is the contribution margin formula for Vancouver businesses?
The contribution margin formula is (Sales Revenue – Variable Costs) / Sales Revenue, expressed as a percentage. For a Vancouver e-commerce seller with $10,000 sales and $6,000 variable costs, it’s 40%, as per Shopify’s encyclopedia on contribution margin.
What is the difference between per-unit and ratio contribution margin?
Per-unit is sales price minus variable cost per item, while the ratio is that amount divided by sales price. Vancouver retailers use both to price products accurately.
Why is contribution margin important for product decisions?
It guides dropping unprofitable products or boosting high-margin ones. In Vancouver’s dynamic economy, this informs inventory choices for small businesses.
How does contribution margin tie to e-commerce tax setups?
Accurate margins help factor in canada sales tax rates for net profitability. Shopify resources highlight integrating taxes into variable costs for precise e-commerce analysis.
How to perform break even analysis in Vancouver?
Break even analysis in Vancouver divides fixed costs by contribution margin per unit. Local businesses use tools like QuickBooks to calculate required sales volume amid regional taxes.
What is break even analysis for Canadian small businesses?
It determines sales needed to cover costs, using contribution margin. For Canadian firms, including Vancouver operations, it supports budgeting with GST/HST considerations per Shopify guidelines.
These responses recap core concepts, aiding strategic decisions for Vancouver enterprises.
Leveraging Contribution Margin for Vancouver Success
In the dynamic landscape of Contribution Margin in Vancouver, mastering the contribution margin formula empowers businesses to optimize profits and make informed decisions. Key Vancouver margin takeaways include using break even analysis in Vancouver to navigate competitive markets, refine product mixes, and enhance forecasting for sustainable growth. By applying these tools, as highlighted in Cube Software’s contribution margin income statement for cleaner financial outcomes, local companies achieve sharper profitability insights.
For a tailored local profitability wrap-up, partner with Transcounts, Vancouver’s trusted accounting experts. Our fractional CFO services deliver customized strategies to implement these principles, driving your business toward enduring success and financial clarity.