Table of Contents
SKU Margin Reporting Essentials for Vancouver Ecommerce
In the fast-paced ecommerce landscape for businesses in Vancouver, unprofitable SKUs can quietly erode profits amid high competition and rising costs. A Stock Keeping Unit (SKU) represents a unique product variant, and SKU margin reporting for ecommerce in Vancouver provides critical visibility into which items drive revenue versus those draining resources. According to the SKU Profitability Analysis Guide, 80% of ecommerce businesses fail to track SKU margins accurately, often overlooking local challenges like British Columbia’s provincial sales taxes and elevated shipping costs across Canada.
This guide outlines a straightforward 7-step process for ecommerce gross margin calculation, from gathering sales data to analyzing profitability metrics. You’ll learn to identify top performers for better inventory allocation and refine pricing strategies informed by real Vancouver ecommerce profitability tracking.
As a Vancouver-based firm, Transcounts specializes in ecommerce bookkeeping services vancouver bc, integrating Shopify with tools like A2X for automatic sales reconciliation and QuickBooks for seamless HST compliance. Our expertise delivers enhanced cash flow visibility, empowering local sellers–such as those handling cross-border US sales–to make data-driven decisions and boost overall profitability.
Preparing Your Data for SKU Margin Analysis
Before launching into detailed SKU margin reporting for ecommerce in Vancouver, proper preparation ensures accurate insights for your online store. As a Vancouver ecommerce owner, gathering the right data sets a strong foundation, helping you avoid common errors and comply with local regulations. This step-by-step guide simplifies the process, even if finance isn’t your expertise.
Start with data gathering to build your baseline. Key sources include sales reports from platforms like Shopify, which provide revenue and units sold. For ecommerce gross margin calculation, pull cost of goods sold (COGS) from supplier invoices, including shipping and import fees relevant to Vancouver operations. Don’t overlook overhead like warehouse fees in BC; allocate these proportionally across SKUs. Categorize products by type for clearer pre-analysis setup for product profits–export everything as CSV files for easy import. For multi-channel sales from Amazon or Etsy, consolidate data to capture full revenue streams.
Next, set up tools for seamless integration. Recommended options are QuickBooks or Xero, which connect directly with Shopify to automate data flows. According to ecommerce profit margins experts, such integrations reduce data entry errors by 70%, boosting reliability for Canadian sellers. For SKU profitability analysis, consider Transcounts’ onboarding process, which handles automated data pulls and offers Inventory Accounting for Shopify Vancouver. This Vancouver online store margin preparation includes categorizing SKUs and handling multi-channel inputs efficiently.
Finally, perform a compliance check for accuracy in BC. Ensure HST and PST are included in your datasets to meet CRA requirements, aiming for healthy 30-50% gross margins typical for Vancouver ecommerce. If dealing with US sales, convert USD figures promptly to avoid discrepancies. Watch for pitfalls like incomplete COGS data, which can skew results–double-check all entries before proceeding.
Collecting and Organizing Sales Data by SKU
Begin your SKU margin reporting for ecommerce in Vancouver by exporting sales reports from platforms like Shopify. Follow these numbered steps to structure your data effectively:
- Access your sales dashboard and select the export function for transaction history, filtering by date range to capture seasonal BC demand fluctuations.
- Break down revenue by individual SKU, noting units sold and average selling price to support ecommerce gross margin calculation.
- Import the data into Excel or Google Sheets, creating columns for date, SKU code, quantity, and revenue.
- Cross-reference with inventory logs to flag discrepancies, and integrate multi-channel sources for a holistic view. Use Transcounts’ A2X tool for automated reconciliation of sales data in Vancouver.
[Screenshot placeholder: Shopify export interface]
Organizing data by SKU code prevents 40% of reporting errors, as highlighted in best practices for SKU inventory management. This foundational step ensures accurate data structuring for Vancouver product margins, avoiding misguided inventory decisions that could impact profitability.
For tips, always back up your spreadsheets before edits, and apply filters to prioritize high-volume SKUs in your SKU profitability analysis. This organized sales data pairs seamlessly with cost inputs in the next step for comprehensive margin views, empowering confident ecommerce growth in Vancouver.
Calculating COGS for Each SKU
Once you have sales data from Step 1, the next layer involves pinpointing costs to derive accurate profits. Begin by gathering purchase invoices from suppliers and freight charges for shipments. For each SKU, tally total costs including goods value, inbound shipping, and any handling fees. Divide these by the number of units received to get per-unit COGS; for example, in Excel, use =(Total Purchase + Freight)/Units formula for ecommerce gross margin calculation. Adjust for waste or returns, which can add 5-10% in online retail, and factor in Vancouver-specific fees like customs duties on US imports–average ecommerce shipping adds 15-20% to COGS in Canada, per fulfillment experts.
Transcounts’ inventory tracking automates these updates, ensuring real-time COGS assessment for Vancouver online products.
Cost Components
- Variable costs: Direct materials and per-unit shipping.
- Fixed costs: Warehouse storage allocated across SKUs.
- Local fees: Import duties for cross-border goods.
Why it matters: Precise SKU margin reporting for ecommerce in Vancouver reveals hidden expenses impacting pricing strategy, preventing underpricing that erodes profits. For SKU profitability analysis, incorporate these local fees to align with BC realities and support informed decisions on product lines.
Tips: Categorize variable versus fixed costs early to streamline Contribution Margin Vancouver computations. Use tools like QuickBooks integrations for automated allocations, building toward Step 3’s full margin derivation.
Deriving Gross Margins from Sales and COGS
With sales and COGS data organized from previous steps, computing gross margins offers Vancouver ecommerce sellers a clear profitability view. Use the ecommerce gross margin calculation formula: (Revenue – COGS) / Revenue * 100 to determine the percentage for each SKU. For example, if a T-shirt generates $1,000 in revenue with $550 COGS, the margin is ($1,000 – $550) / $1,000 * 100 = 45%. Sort results in a spreadsheet to highlight high and low performers, adjusting for BC HST on reported revenue to ensure accurate gross profit computation for Vancouver SKUs. This step typically takes under an hour with tools like QuickBooks.
Understanding these margins links directly to business health, as healthy ranges of 40-60% signal strong potential for growth in Canadian online retail, though Vancouver costs may adjust benchmarks to 35-50%. Top ecommerce firms achieve 45% gross margins through precise calculations, per industry insights.
Here’s a sample calculation table for clarity:
| SKU | Revenue | COGS | Gross Margin (%) |
|---|---|---|---|
| T-shirt | $1,000 | $550 | 45 |
| Mug | $800 | $560 | 30 |
| Backpack | $1,200 | $540 | 55 |
These figures reveal the backpack as a standout, while the mug needs pricing review. Sorting such data empowers informed decisions on inventory focus.
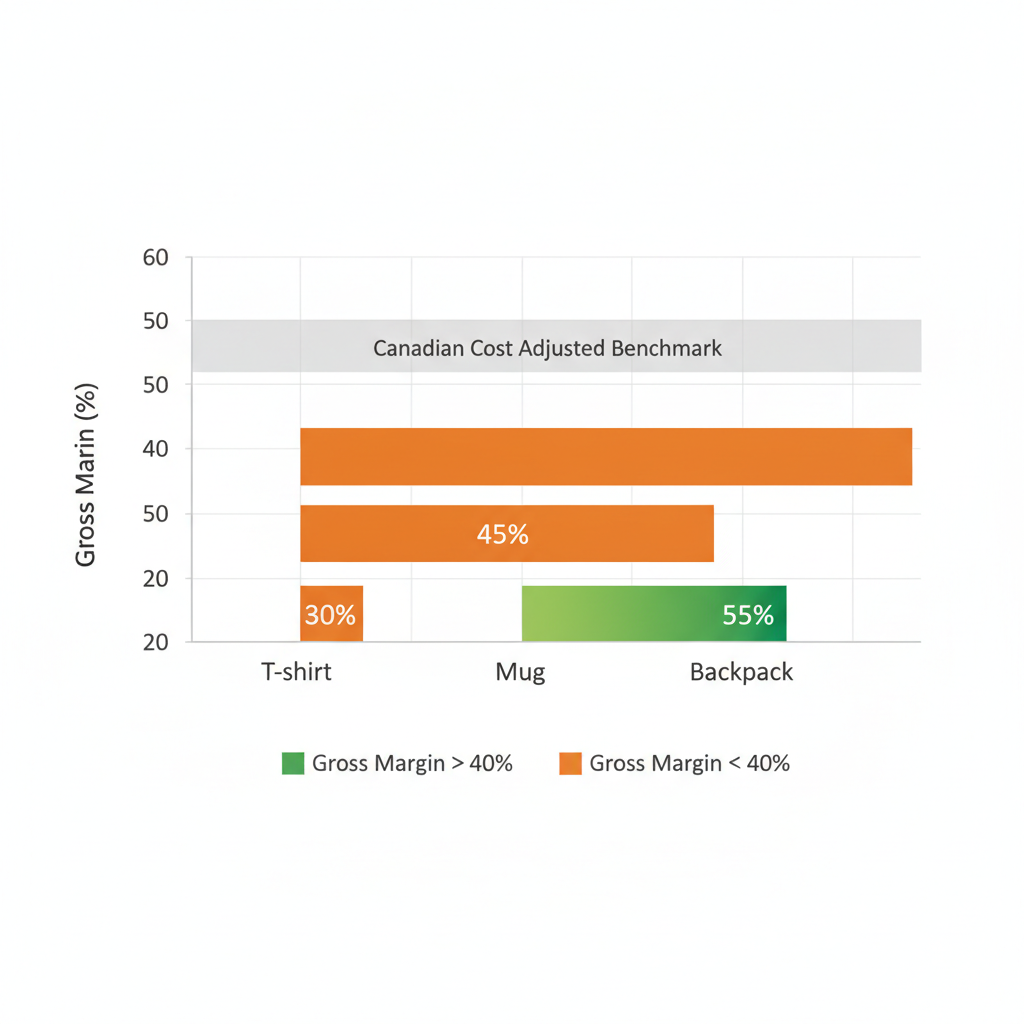
Gross margin breakdown for sample Vancouver ecommerce SKUs
In SKU profitability analysis, watch for distortions from discounts or bundles impacting multiple items–treat bundled sales carefully to avoid understating margins. For SKU margin reporting for ecommerce in Vancouver, Transcounts automates this via QuickBooks dashboards, simplifying the process. This foundational view sets up Step 4’s overhead allocation for comprehensive net profitability insights.
Allocating Overhead Costs to SKUs
After completing the ecommerce gross margin calculation in Step 3, the next step involves allocating indirect costs to individual SKUs. This overhead distribution for Vancouver products ensures precise net margins that account for the high-cost BC environment. Start by identifying key overhead categories such as rent, advertising, utilities, and Vancouver-specific expenses like port fees.
Choose an allocation method suited to your SKU profitability analysis. Options include:
- Sales proportion: Distribute based on each SKU’s revenue share.
- Activity-Based Costing (ABC): Assign costs by activity drivers, as proper allocation reveals 20-30% hidden losses in SKUs per industry insights.
Apply a simple formula: (Total Overhead × SKU Revenue Percentage) / SKU Units Sold. For example, if total overhead is $10,000 and a product represents 20% of revenue with 500 units, allocate $40 per unit. Document all assumptions for CRA audit trails, including cross-border factors like us sales tax for bc shopify sellers vancouver.
This process is vital for SKU margin reporting for ecommerce in Vancouver, contrasting gross margins with true net profitability and uncovering unprofitable items. Transcounts provides fractional controller support for complex setups.
Tips for small businesses: Begin with basic sales proportion to avoid overcomplication, then refine to ABC as data grows. Review allocations quarterly to adapt to fluctuating BC costs.
Conducting Full SKU Profitability Review
After allocating overheads from Step 4, dive into a thorough profit review for Vancouver inventory. Begin by compiling net margins using the formula: (Revenue – COGS – Allocated Overhead) / Revenue. This builds on ecommerce gross margin calculation to reveal true performance. Rank SKUs by margin percentage and absolute profit, employing pivot tables to analyze trends over time. Factor in local variables, such as seasonal Vancouver tourism sales spikes, and set thresholds for healthy margins above 25% net. Flag low performers for action, like pruning, as net margins below 15% signal rationalization needs per ecommerce profit margins insights.
This SKU profitability analysis drives strategic decisions, enhancing overall profitability for Vancouver ecommerce operations. By identifying optimization opportunities, businesses can boost efficiency and focus resources on high-value items, turning data into actionable growth.
For effective SKU profitability analysis, leverage tools like Excel charts or Transcounts’ KPI dashboards to visualize rankings and trends. These visuals make complex data accessible, supporting an iterative review process that refines strategies leading into Step 6 improvements.
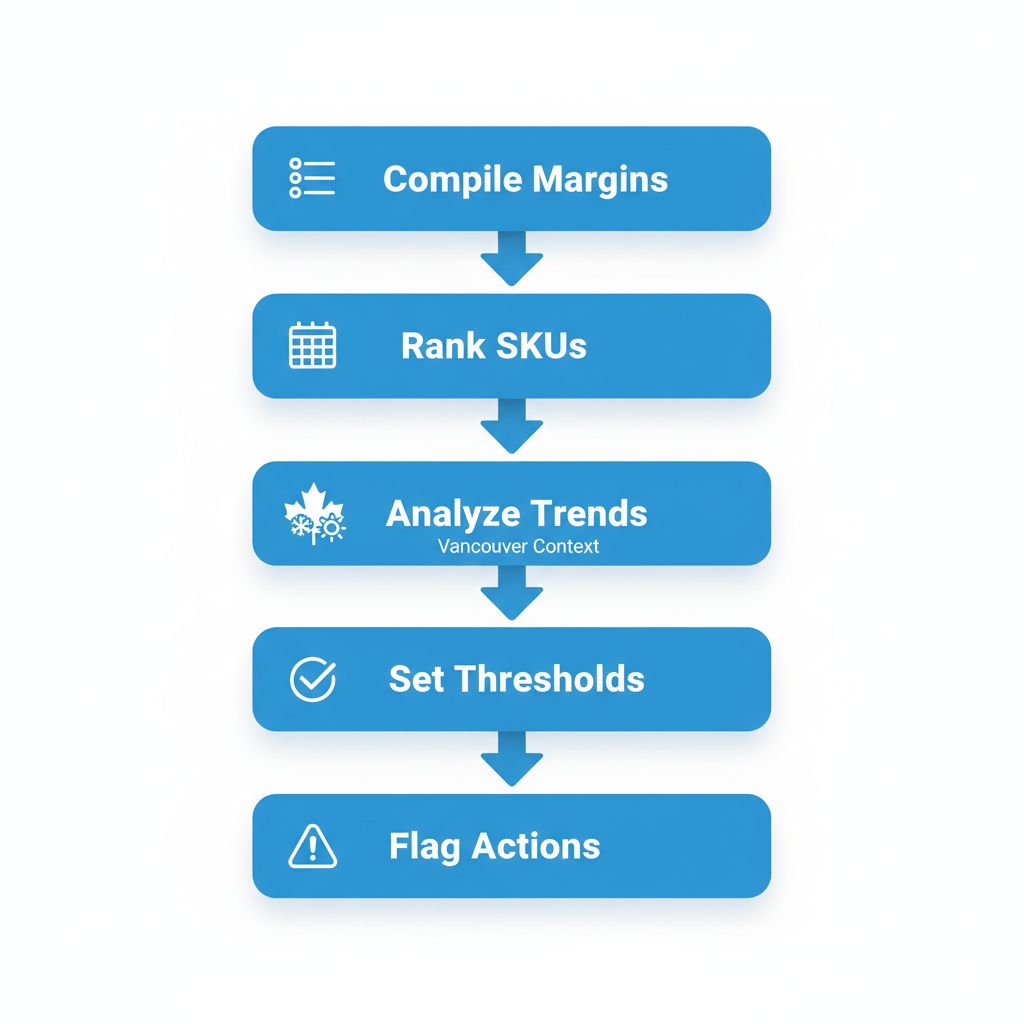
Vertical process flow for conducting full SKU profitability review in Vancouver ecommerce
Optimizing Based on Margin Insights
With insights from Step 5’s margin analysis in hand, Vancouver ecommerce businesses can implement targeted optimizations to boost profitability. Start by reviewing low-margin SKUs through SKU profitability analysis or consult small business accounting tips Vancouver. For these items, consider raising prices slightly to cover costs influenced by local factors like Vancouver’s higher labor expenses in fulfillment. Alternatively, bundle low performers with high-margin products to improve overall sales value. Negotiate better terms with suppliers by highlighting your consistent order volumes, potentially securing discounts that enhance margins.
Reduce inventory on unprofitable SKUs to free up capital for more promising stock, a tactic especially vital in BC’s competitive market where storage costs add pressure. Rationalizing just 20% of SKUs can increase profits by 15%, as seen in Vancouver cases where ecommerce sellers cut slow-movers and refocused on top performers. This boosts the bottom line by reallocating resources efficiently and sharpening competitive edges.
For sustained gains leading into Step 7’s monitoring, track impacts quarterly using ecommerce gross margin calculation tools. Implement SKU margin reporting for ecommerce in Vancouver to measure changes accurately. Transcounts’ forecasting supports these optimization strategies for Vancouver SKUs, ensuring data-driven decisions and regular reviews.
Monitoring and Iterating Margin Reports
To maintain robust SKU margin reporting for ecommerce in Vancouver, establish ongoing margin tracking in Vancouver through monthly automated reports in tools like Xero. Set up dashboards to generate variance alerts, review discrepancies against forecasts using SKU profitability analysis, and adjust inventory allocations as your business scales. Benchmark your ecommerce gross margin calculation against BC industry averages to identify improvement areas, and document all changes meticulously for tax audits. As operations grow, leverage Transcounts’ fractional CFO services for advanced KPI tracking, ensuring compliance and optimization in Canada’s dynamic market.
This iterative approach adapts to fluctuations like CAD exchange rates, safeguarding profitability. Monthly reviews catch 25% more opportunities in Vancouver’s fast-paced ecommerce scene, directly enhancing gross margin impacts on overall business health and revealing benefits of SKU reports for long-term decision-making.
For efficiency, automate email alerts for variances exceeding 10%, and schedule quarterly deep dives. Integrate with existing tools to flag issues proactively, fostering sustainable growth and seamless transitions to troubleshooting any implementation challenges.
Addressing Common SKU Reporting Challenges
Managing SKU margin reporting for ecommerce in Vancouver can feel overwhelming, especially with hurdles like data inaccuracies and cost misallocations that plague local sellers. These issues often stem from incomplete sales data imports or overestimation of overhead, leading to distorted views of profitability in the fast-paced BC market. For instance, hidden logistics costs distort up to 30% of margins, as noted in industry insights on fulfillment expenses, while cross-border sales introduce multi-currency complexities. Vancouver online retailers frequently grapple with these, questioning how to identify low margin SKUs or conduct reliable ecommerce gross margin calculation amid seasonal fluctuations.
To resolve these pain points, consider these targeted fixes:
- Incomplete data imports: Verify API connections between platforms like Shopify and QuickBooks to ensure all sales sync properly; this addresses gaps that skew SKU profitability analysis.
- Overhead overestimation: Implement activity-based costing (ABC) methods, which resolve 50% of allocation errors according to profitability experts, providing a clearer picture for ecommerce operations.
- Variable costs in seasonal markets: Average costs over quarters to smooth out Vancouver’s holiday spikes, helping fix profitability hurdles in BC ecommerce.
- Multi-currency transactions: Convert USD sales at average rates per CRA guidelines and use tools like Plooto for reconciliations, reducing discrepancies from US nexus.
- Hidden fees eroding margins: Revisit supplier contracts and audit logistics regularly to uncover low-hanging fruits that boost overall health.
For self-diagnosis, use this checklist: Review recent reports for unexplained variances; cross-check platform exports; calculate a trial margin using ABC on top SKUs. If discrepancies persist, a healthy profit margin for ecommerce–typically 20-30% after inflation–may require professional intervention.
Prevent recurrence by adopting automated tools and quarterly reviews, tying into broader strategies like those from Transcounts (accounting services Vancouver) for catch-up bookkeeping. This builds confidence in troubleshooting margins for Vancouver online retail, ensuring long-term success without constant frustration.
Driving Ecommerce Success with SKU Insights in Vancouver
Mastering SKU margin reporting for ecommerce in Vancouver empowers sellers to transform raw data into actionable strategies for long-term growth. By following the seven-step process–from data preparation and categorization to ongoing iteration–Vancouver businesses can uncover hidden inefficiencies and optimize operations. This structured approach ensures CRA-compliant reporting, streamlining compliance while enhancing visibility into revenue streams.
Key outcomes include 20-30% profitability gains through targeted optimizations, with ecommerce gross margin calculation revealing healthy targets of 30% or more. SKU profitability analysis highlights top performers, driving Vancouver ecommerce margin mastery and better cash flow for scaling in BC. Businesses leveraging these insights grow 25% faster, achieving sustained profitability for online BC businesses amid competitive markets.
Ready to elevate your operations? Partner with Transcounts for expert, fixed-fee implementation tailored to Vancouver sellers. Contact us today for a consultation and step into data-driven ecommerce dominance.